Use Prometheus to monitor Nomad metrics
This tutorial explains how to configure Prometheus to integrate with a Nomad cluster and Prometheus Alertmanager. While this tutorial introduces the basics of enabling telemetry and alerting, a Nomad operator can go much further by customizing dashboards and integrating different receivers for alerts.
Think of a scenario where a Nomad operator needs to deploy Prometheus to collect metrics from a Nomad cluster. The operator must enable telemetry on the Nomad servers and clients as well as configure Prometheus to use Consul for service discovery. The operator must also configure Prometheus Alertmanager so notifications can be sent out to a specified receiver.
This tutorial will deploy Prometheus with a configuration that accounts for a
highly dynamic environment. Integrate service discovery into the configuration
file to avoid using hard-coded IP addresses. Place the Prometheus deployment
behind fabio—this will allow access to the Prometheus web interface by
allowing the Nomad operator to hit any of the client nodes at the / path.
Prerequisites
To perform the tasks described in this guide, you need to have a Nomad environment with Consul installed. You can use this repository to provision a sandbox environment. This tutorial will assume a cluster with one server node and three client nodes.
Note
This tutorial is for demo purposes and is only using a single server node. In a production cluster, 3 or 5 server nodes are recommended. The alerting rules defined in this tutorial are for instructional purposes. Refer to Alerting Rules for more information.
Enable telemetry on Nomad servers and clients
Add the stanza below in your Nomad client and server configuration files. If you
have used the provided repository in this tutorial to set up a Nomad cluster, the
configuration file will be /etc/nomad.d/nomad.hcl. After making this change,
restart the Nomad service on each server and client node.
telemetry { collection_interval = "1s" disable_hostname = true prometheus_metrics = true publish_allocation_metrics = true publish_node_metrics = true}Create and run a Fabio job
Create the job specification for Fabio
Create a job for Fabio named fabio.nomad.hcl with the following specification:
job "fabio" { datacenters = ["dc1"] type = "system" group "fabio" { task "fabio" { driver = "docker" config { image = "fabiolb/fabio" network_mode = "host" } resources { cpu = 100 memory = 64 network { port "lb" { static = 9999 } port "ui" { static = 9998 } } } } }}To learn more about Fabio and the options used in this job file, consult Load
Balancing with Fabio. For the purpose of this guide, it is important
to note that the type option is set to system so that Fabio will be deployed
on all client nodes. The job specification also defines network_mode as host
so that Fabio will be able to use Consul for service discovery.
Run the Fabio job
You can now register the Fabio job:
$ nomad job run fabio.nomad.hcl==> Monitoring evaluation "7b96701e" Evaluation triggered by job "fabio" Allocation "d0e34682" created: node "28d7f859", group "fabio" Allocation "238ec0f7" created: node "510898b6", group "fabio" Allocation "9a2e8359" created: node "f3739267", group "fabio" Evaluation status changed: "pending" -> "complete"==> Evaluation "7b96701e" finished with status "complete"At this point, you should be able to visit any one of your client nodes at port
9998 and bring up the web interface for Fabio. The routing table will be empty
since you have not yet deployed anything that Fabio can route to. Accordingly,
if you visit any of the client nodes at port 9999 at this point, you will get
a 404 HTTP response. That will change soon.
Create and run a Prometheus job
Create the job specification for Prometheus
Create a job for Prometheus and name it prometheus.nomad.hcl
job "prometheus" { datacenters = ["dc1"] type = "service" group "monitoring" { count = 1 network { port "prometheus_ui" { static = 9090 } } restart { attempts = 2 interval = "30m" delay = "15s" mode = "fail" } ephemeral_disk { size = 300 } task "prometheus" { template { change_mode = "noop" destination = "local/prometheus.yml" data = <<EOH---global: scrape_interval: 5s evaluation_interval: 5s scrape_configs: - job_name: 'nomad_metrics' consul_sd_configs: - server: '{{ env "NOMAD_IP_prometheus_ui" }}:8500' services: ['nomad-client', 'nomad'] relabel_configs: - source_labels: ['__meta_consul_tags'] regex: '(.*)http(.*)' action: keep scrape_interval: 5s metrics_path: /v1/metrics params: format: ['prometheus']EOH } driver = "docker" config { image = "prom/prometheus:latest" volumes = [ "local/prometheus.yml:/etc/prometheus/prometheus.yml", ] ports = ["prometheus_ui"] } service { name = "prometheus" tags = ["urlprefix-/"] port = "prometheus_ui" check { name = "prometheus_ui port alive" type = "http" path = "/-/healthy" interval = "10s" timeout = "2s" } } } }}Notice the use of the template stanza to create a Prometheus configuration
using environment variables. In this case, the job uses the environment
variable NOMAD_IP_prometheus_ui in the consul_sd_config section to ensure
Prometheus can use Consul to detect and scrape targets. This works in this
example because Consul is installed alongside Nomad. Additionally, a benefit
from this configuration by avoiding the need to hard-code IP addresses. If you
did not use the repo provided in this tutorial to create a Nomad cluster, be sure
to point your Prometheus configuration to a Consul server you have set up.
The volumes option allows you to take the configuration file that the template stanza dynamically creates and place it in the Prometheus container.
Run the Prometheus job
You can now register the job for Prometheus:
$ nomad job run prometheus.nomad.hcl==> Monitoring evaluation "4e6b7127" Evaluation triggered by job "prometheus" Evaluation within deployment: "d3a651a7" Allocation "9725af3d" created: node "28d7f859", group "monitoring" Evaluation status changed: "pending" -> "complete"==> Evaluation "4e6b7127" finished with status "complete"Prometheus is now deployed. You can visit any of your client nodes at port
9999 to visit the web interface. There is only one instance of Prometheus
running in the Nomad cluster, but you are automatically routed to it
regardless of which node you visit because Fabio is deployed and running on the
cluster as well.
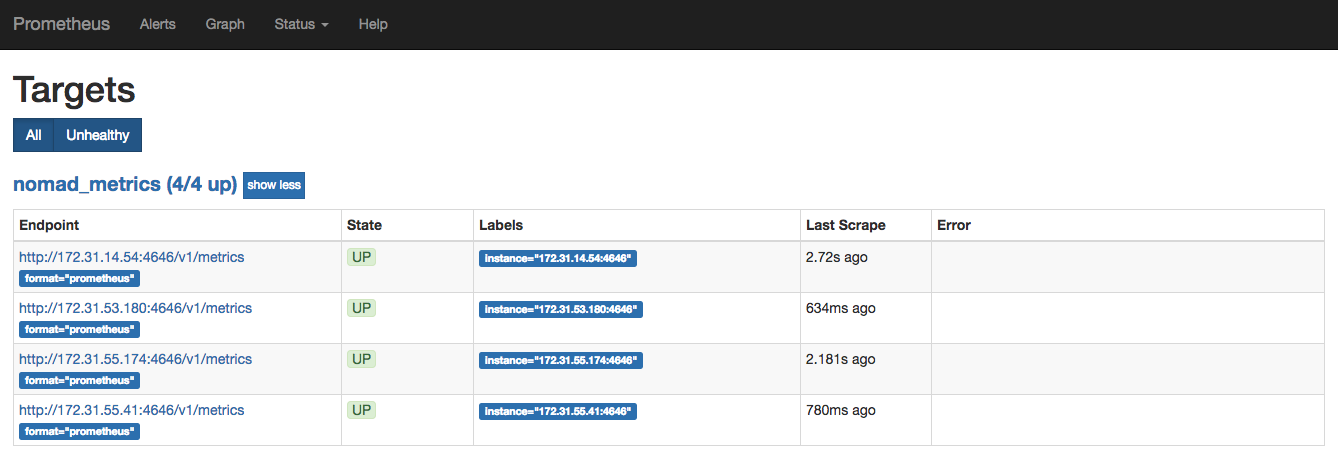
At the top menu bar, click on Status and then Targets. The target list
should include all of your Nomad nodes. Note that the IP addresses will
be different in your cluster.
Use Prometheus to query how many jobs are running in our Nomad cluster.
On the main page, type nomad_nomad_job_summary_running into the query
section. You can also select the query from the drop-down list.
The value of our Fabio job is 3 since it is using the system scheduler type.
This makes sense because there are three running Nomad clients in our demo
cluster. The value of our Prometheus job, on the other hand, is 1 since you
have only deployed one instance of it. To learn more about other metrics, visit
the telemetry section.
Deploy Alertmanager
Now that you have enabled Prometheus to collect metrics from our cluster and verified the state of our jobs, deploy Alertmanager. Keep in mind that Prometheus sends alerts to Alertmanager. It is then Alertmanager's job to send out the notifications on those alerts to any designated receiver.
Create a job for Alertmanager and named it alertmanager.nomad.hcl
job "alertmanager" { datacenters = ["dc1"] type = "service" group "alerting" { count = 1 restart { attempts = 2 interval = "30m" delay = "15s" mode = "fail" } ephemeral_disk { size = 300 } task "alertmanager" { driver = "docker" config { image = "prom/alertmanager:latest" ports = ["alertmanager_ui"] } resources { network { port "alertmanager_ui" { static = 9093 } } } service { name = "alertmanager" tags = ["urlprefix-/alertmanager strip=/alertmanager"] port = "alertmanager_ui" check { name = "alertmanager_ui port alive" type = "http" path = "/-/healthy" interval = "10s" timeout = "2s" } } } }}Configure Prometheus to integrate with Alertmanager
Now that you have deployed Alertmanager, slightly modify the Prometheus job configuration to allow it to recognize and send alerts to it. Note that there are some rules in the configuration that refer to a web server you will deploy soon.
Below is the same Prometheus configuration detailed above, but with added some sections that hook Prometheus into the Alertmanager and set up some Alerting rules.
job "prometheus" { datacenters = ["dc1"] type = "service" group "monitoring" { count = 1 restart { attempts = 2 interval = "30m" delay = "15s" mode = "fail" } ephemeral_disk { size = 300 } network { port "prometheus_ui" { static = 9090 } } task "prometheus" { template { change_mode = "noop" destination = "local/webserver_alert.yml" data = <<EOH---groups:- name: prometheus_alerts rules: - alert: Webserver down expr: absent(up{job="webserver"}) for: 10s labels: severity: critical annotations: description: "Our webserver is down."EOH } template { change_mode = "noop" destination = "local/prometheus.yml" data = <<EOH---global: scrape_interval: 5s evaluation_interval: 5s alerting: alertmanagers: - consul_sd_configs: - server: '{{ env "NOMAD_IP_prometheus_ui" }}:8500' services: ['alertmanager'] rule_files: - "webserver_alert.yml" scrape_configs: - job_name: 'alertmanager' consul_sd_configs: - server: '{{ env "NOMAD_IP_prometheus_ui" }}:8500' services: ['alertmanager'] - job_name: 'nomad_metrics' consul_sd_configs: - server: '{{ env "NOMAD_IP_prometheus_ui" }}:8500' services: ['nomad-client', 'nomad'] relabel_configs: - source_labels: ['__meta_consul_tags'] regex: '(.*)http(.*)' action: keep scrape_interval: 5s metrics_path: /v1/metrics params: format: ['prometheus'] - job_name: 'webserver' consul_sd_configs: - server: '{{ env "NOMAD_IP_prometheus_ui" }}:8500' services: ['webserver'] metrics_path: /metricsEOH } driver = "docker" config { image = "prom/prometheus:latest" volumes = [ "local/webserver_alert.yml:/etc/prometheus/webserver_alert.yml", "local/prometheus.yml:/etc/prometheus/prometheus.yml" ] ports = ["prometheus_ui"] } service { name = "prometheus" tags = ["urlprefix-/"] port = "prometheus_ui" check { name = "prometheus_ui port alive" type = "http" path = "/-/healthy" interval = "10s" timeout = "2s" } } } }}Notice, these few important sections to this job file:
Another template stanza that defines an alerting rule for our web server. Namely, Prometheus will send out an alert if it detects the
webserverservice has disappeared.An
alertingblock to our Prometheus configuration as well as arule_filesblock to make Prometheus aware of Alertmanager as well as the rule it has defined.The job is now also scraping Alertmanager along with our web server.
Deploy a web server workload
Create a job for our web server and name it webserver.nomad.hcl
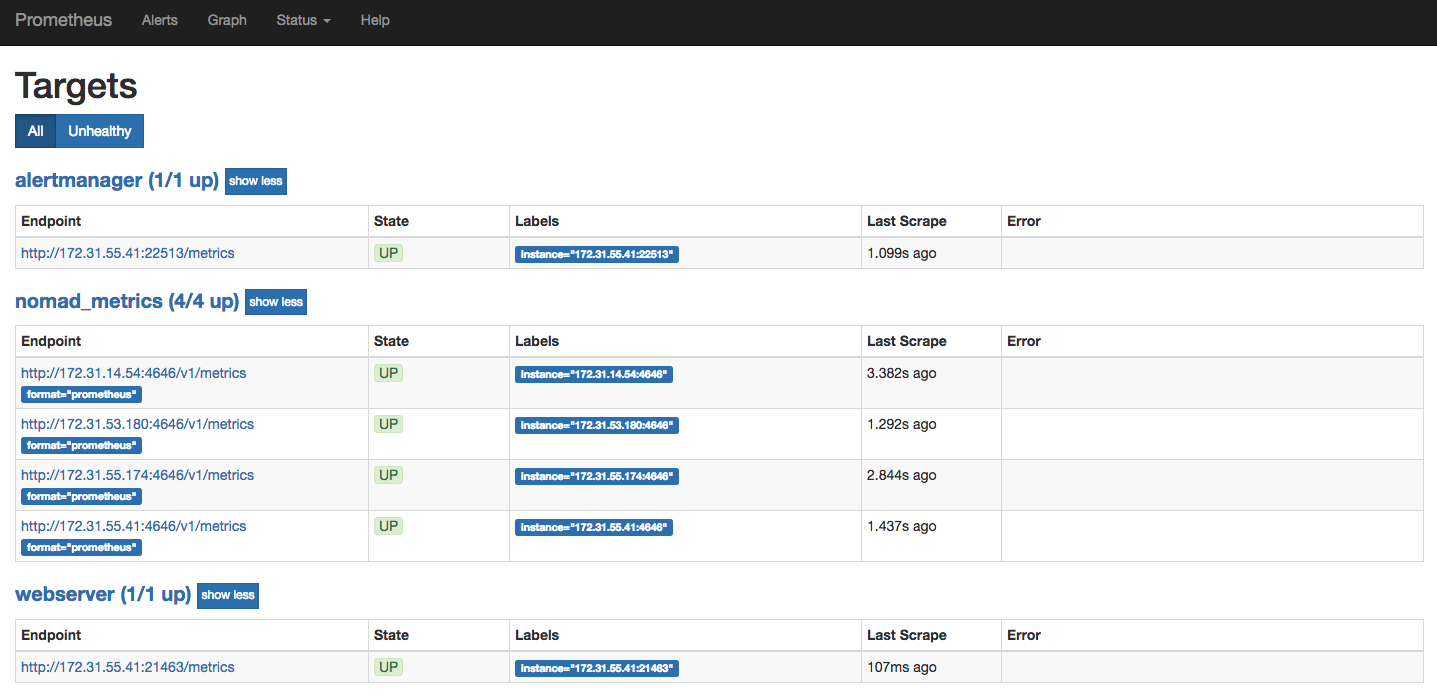
job "webserver" { datacenters = ["dc1"] group "webserver" { task "server" { driver = "docker" config { image = "hashicorp/demo-prometheus-instrumentation:latest" } resources { cpu = 500 memory = 256 network { port "http"{} } } service { name = "webserver" port = "http" tags = [ "testweb", "urlprefix-/webserver strip=/webserver", ] check { type = "http" path = "/" interval = "2s" timeout = "2s" } } } }}At this point, re-run your Prometheus job. After a few seconds, the web server and Alertmanager appear in your list of targets.
You should also be able to go to the Alerts section of the Prometheus web
interface and observe the alert that you have configured. No alerts are active
because the web server is up and running.
Stop the web server task
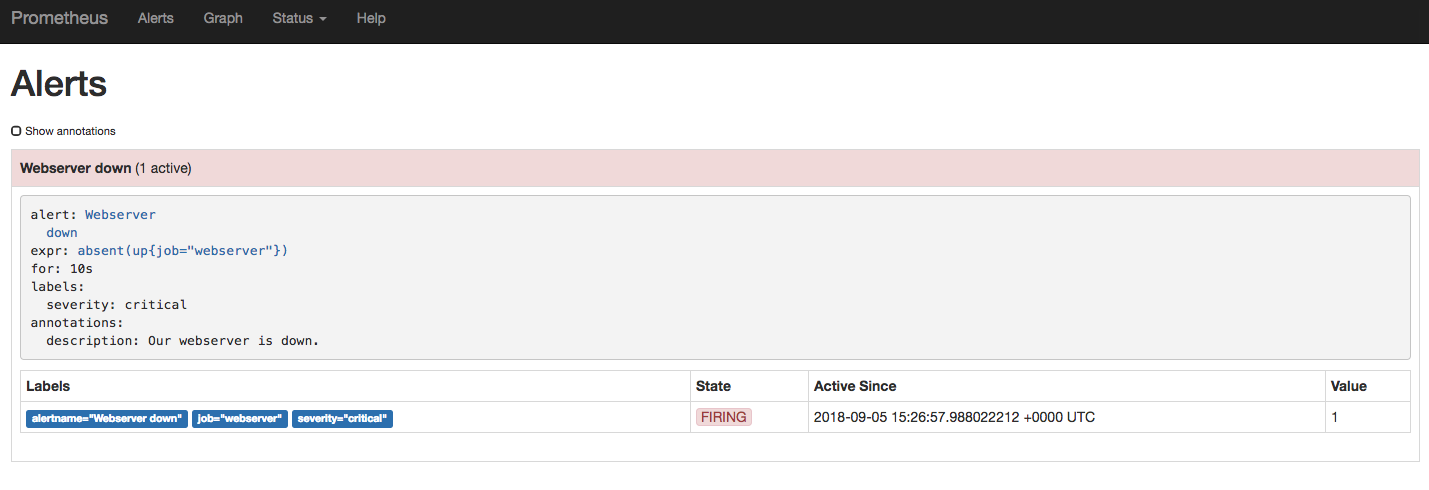
Run nomad stop webserver to stop the webserver. After a few seconds, an active
alert will appear in the Alerts section of the web interface.
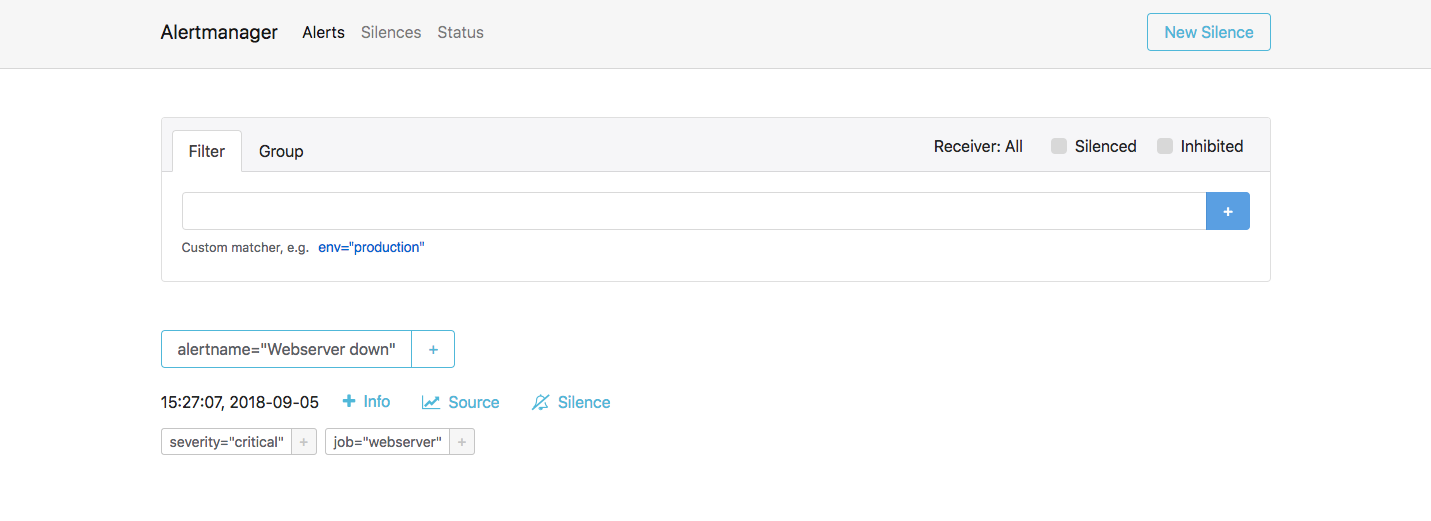
You can now go to the Alertmanager web interface to verify that Alertmanager has
received this alert as well. Since Alertmanager has been configured behind
Fabio, go to the IP address of any of your client nodes at port 9999 and use
/alertmanager as the route. An example is shown below:
< client node IP >:9999/alertmanager
Verify that Alertmanager has received the alert.
Next steps
Read more about Prometheus Alertmanager and how to configure it to send out notifications to a receiver of your choice.


